Getting Started with the Snowload Mapserver
The mapserver will initially load with a view of the Portland to Mount Hood area. The snowload grid label values are automatically set to be on when you first view the map. If you do not want to view the labels you can turn them on or off by selecting the check box in the legend for “Snowload GRID values”. At this zoom level the snowload grid value labels are visible and turned on, however, if you choose to zoom out to a view which shows the whole state the grid labels default to off to avoid clutter. As the user you can zoom in or out and you can choose to turn on or off any of the layers in the legend.
Many of the mapserver controls have mouse-over, pop-up help boxes that provide a brief text description or help file. The following is a summary of the controls.
The Legend:
The legend appears to the right of the map window and includes all the layers that are available for viewing.
The check boxes allow for selecting individual layers for viewing so that you can turn on or off layers of interest. If you click on the  plus symbol next to any of the layers, it will expand to display the legend and symbology for that layer.
If you click on the  minus symbol next to any of the layers, it will contract so that the legend for that layer is no longer visible.
Quick Zooming and Panning:
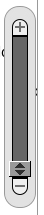 The Zoom Control may be used as a means of quickly zooming in or out, just use the left mouse button to select and hold the
  arrows while sliding for a plus or minus zoom level.
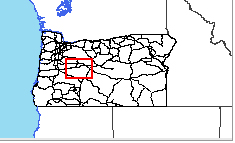 The overview window shows your location and zoom level within the base map, as indicated by the red box in the screenshot shown on the left.
This window can be used to maneuver or jump from area to area within the map. To move to a new area of interest, either drag the red box to a new location, or just point with the mouse in the overview window on the locator map and then click, the map will “jump” to the new area of interest.
Map Tools:
The  “Zoom to Full Extent” button will return the map to its original configuration.
The  “Zoom in” will activate the mouse
  Zoom-in feature. The Zoom-in feature will allow you to either left click and release or left click and drag a box around the desired area to be zoomed to. When you release the left mouse button, the map will zoom to the chosen extent.
The  “Zoom out” will activate the mouse
  Zoom-out feature, working in a similar but inverse fashion to the Zoom-in button.
The  “Pan” button, when selected, allows you to left click and hold to drag and reposition the map to a new area at the existing zoom level. Additionally if you wishe to pan (while holding any tool) this can be accomplished by right clicking and holding down the mouse button to access the panning tool, allowing you to move the map.
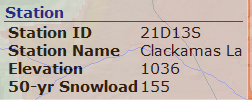 To query the station data make sure that the checkbox in the legend is selected for displaying the stations, then select the “Query”
 button. When the query is selected a bright green box will show up at the top of the map indicating that the query is active. You can view the station values by using a “mouse over” (position the mouse pointer over the station without clicking), and this will open a dynamic window that displays the values for that station. As you move the mouse pointer across any station icon in the map, you need to hold the mouse still for a brief period for the query to retrieve the station values.
To view the actual snowload grid values, select the checkbox in the legend called "Snowload GRID values". The map will only display the grid values as a label.
Links at the top of the page:
PRISM Group Logo: Located in the upper left of the page within the black area of the frame will take you to the PRISM home page at Oregon State University
Documentation: Located in the upper center of the page within the black area of the frame will launch a page that has links to two documents.
- Introduction – A description and introduction to the data and the mapserver.
- Users Guide – “This document” provides a description of the map and how to use the map tools.
Provide Feedback: the provide feedback link is at the top of the webpage above the map, positioned in the black area of the frame, opens a form that lets you submit feedback on the data you are reviewing. Your email address is required in the form.